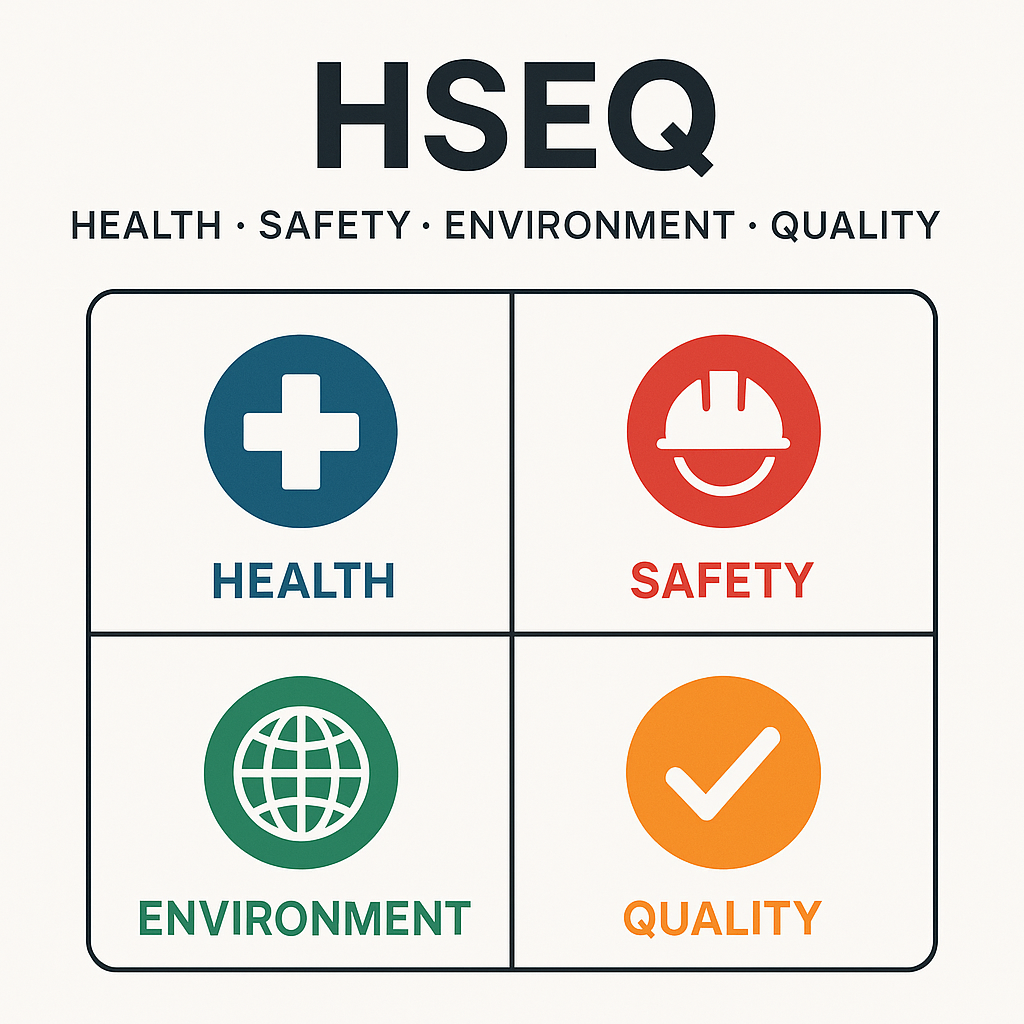
HSEQ metrics—short for Health, Safety, Environment, and Quality metrics—are critical tools that help organizations measure how effectively they manage risks, ensure compliance, and improve overall performance.
These metrics serve as a guidepost, offering insights into what’s working, what’s failing, and what needs immediate attention.

Whether your company operates in construction, manufacturing, healthcare, or energy, tracking the right HSEQ metrics ensures a proactive approach to safety, quality assurance, and environmental stewardship.
Why Are HSEQ Metrics Important?
HSEQ metrics help:
- Identify trends before incidents occur
- Improve accountability across departments
- Support continuous improvement initiatives
- Ensure compliance with ISO standards like ISO 9001, ISO 14001, and ISO 45001
- Boost transparency with stakeholders and regulatory bodies
By embedding HSEQ metrics into dashboards and performance reviews, organizations can make data-driven decisions that protect people, the planet, and productivity.
🔟 Top 10 HSEQ Metrics to Track
Here are the most valuable HSEQ metrics that organizations across industries should monitor regularly:
1. Total Recordable Incident Rate (TRIR)
Focus Area: Health & Safety
TRIR measures the number of work-related injuries per 100 full-time employees annually. It is a key benchmark used by regulatory bodies like OSHA.
Formula:
TRIR = (Number of Recordable Incidents × 200,000) / Total Hours Worked
A lower TRIR indicates a safer workplace.
2. Lost Time Injury Frequency Rate (LTIFR)
Focus Area: Safety
This metric focuses on how frequently employees are injured seriously enough to miss work.
Formula:
LTIFR = (Number of Lost Time Injuries × 1,000,000) / Total Hours Worked
A vital metric for demonstrating operational safety.
3. Near Miss Reporting Rate
Focus Area: Health & Safety
Tracking near misses helps identify hazards before they result in actual harm. An increase in near miss reports often reflects a strong safety culture and employee engagement.
Encourage anonymous reporting tools and recognition for hazard identification.
4. Corrective and Preventive Actions (CAPA) Closed on Time
Focus Area: Quality & Safety
Tracks the percentage of CAPAs that are resolved within the target timeframe.
Delays in closing CAPAs can signal issues with management commitment or resource allocation.
5. Environmental Incidents or Spills
Focus Area: Environment
Monitoring the number and severity of environmental spills or non-compliance events is crucial for sustainability.
Include root cause data and response time to understand environmental risk.
6. Waste Generation and Recycling Rate
Focus Area: Environment
Measure the total waste produced and the proportion that is recycled.
High-performing organizations reduce overall waste while improving recycling and reuse.
Link with your ISO 14001 environmental management goals.
7. Internal and External Audit Findings
Focus Area: Quality, Safety, Environment
Track the number of non-conformities identified in HSEQ audits and how quickly they are resolved.
Use trend data to improve systems and training.
8. Training Completion Rate
Focus Area: Health, Safety, Quality
Measures the percentage of required HSEQ training completed by employees.
Low completion rates can lead to increased incidents and non-compliance with ISO and regulatory requirements.
9. Customer Complaints Related to Quality
Focus Area: Quality
Monitoring quality complaints provides a direct insight into how your operations impact customers.
Include severity levels, recurrence, and response times to build customer trust.
10. Employee Participation in HSEQ Programs
Focus Area: Culture & Engagement
This includes attendance at toolbox talks, involvement in safety committees, and engagement with environmental campaigns.
Employee involvement is a leading indicator of HSEQ culture strength.
📊 Bonus: Visual Dashboard for HSEQ Metrics
Implement an HSEQ dashboard using platforms like:
These platforms allow real-time tracking, alerts, and analytics, ensuring leadership stays informed.
✅ How to Choose the Right HSEQ Metrics
Not every metric fits every organization. Tailor your HSEQ KPIs by asking:
- Does the metric align with your risk profile?
- Can it be measured consistently and objectively?
- Will it drive improvement in your operations?
Choose a balanced mix of:
- Lagging indicators (e.g., incident rates)
- Leading indicators (e.g., training participation, near misses)
🏗️ Real-World Example: Manufacturing Company
A mid-sized Canadian manufacturer integrated HSEQ metrics into their operations using a shared dashboard. Within 12 months:
- TRIR dropped by 28%
- CAPA closure rate improved from 60% to 95%
- Customer complaints fell by 35%
- Recycling rate increased by 20%
Their success was driven by visible targets, department-level ownership, and monthly KPI reviews.
🧩 Linking HSEQ Metrics to ISO and Business Goals
Most HSEQ metrics naturally align with ISO standards:
- ISO 45001: TRIR, LTIFR, training metrics
- ISO 9001: CAPA closure, customer complaints
- ISO 14001: spills, waste, recycling rates
When integrated with corporate KPIs, these metrics help align HSEQ efforts with profitability, ESG targets, and operational excellence.
🔚 Conclusion: Metrics Drive Performance in HSEQ
Tracking HSEQ metrics isn’t just about compliance—it’s about creating a safer, smarter, and more sustainable organization. By focusing on the right indicators, you empower teams to prevent incidents, exceed customer expectations, and protect the environment.
Start with the top 10 metrics above, customize based on your industry, and turn your data into a driver of excellence.

Leave a Reply